Here’s an updated list of online tools to create alternative story forms for the web (2023)
Tools come and go. Here’s a simplified list of tools that work right now for online alternative story forms.
Read more
Help for your newsroom's journey with online and broadcast media


Tools come and go. Here’s a simplified list of tools that work right now for online alternative story forms.
Read more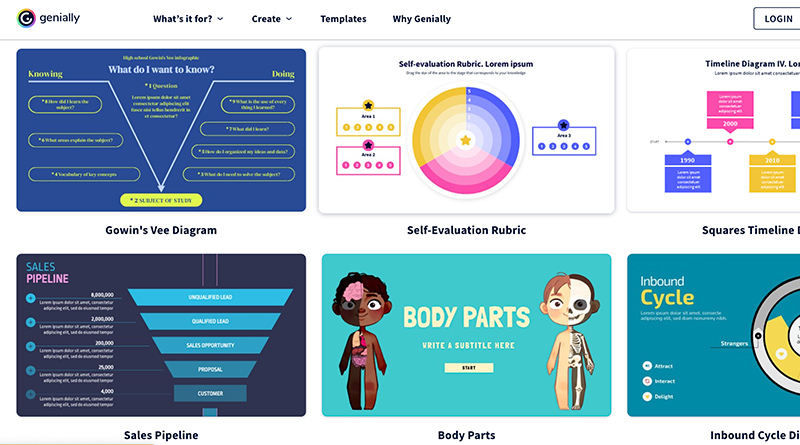
In our online publication, one goal is that each story does something that can’t be done in print. For this
Read more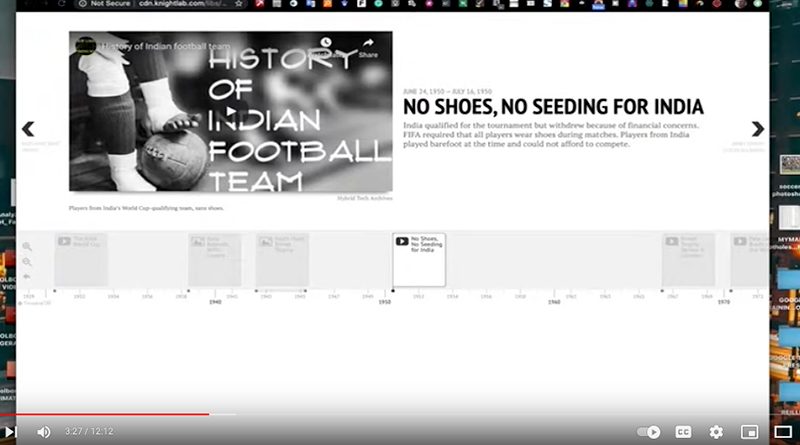
Interactive elements are always great to add to online posts. We’ve talked before here about using Timeline JS and the
Read more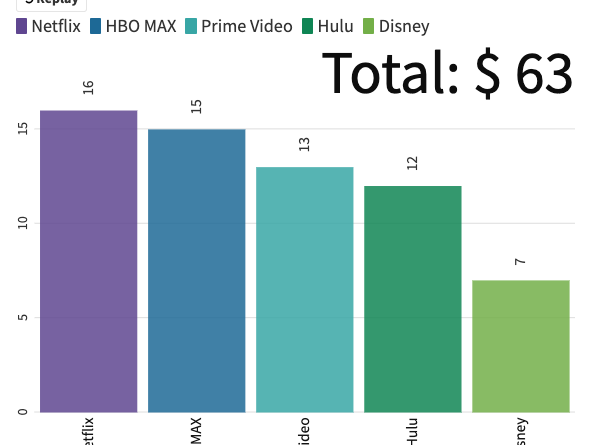
I’ve talked about my love for the web-based data visualization tool Datawrapper before, but there is a free tool that
Read more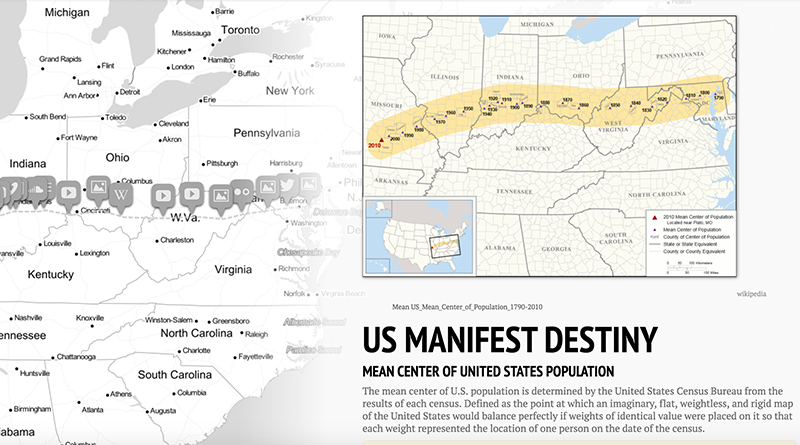
Google Maps is a nice option to use if you want to embed a map on your site. But,
Read more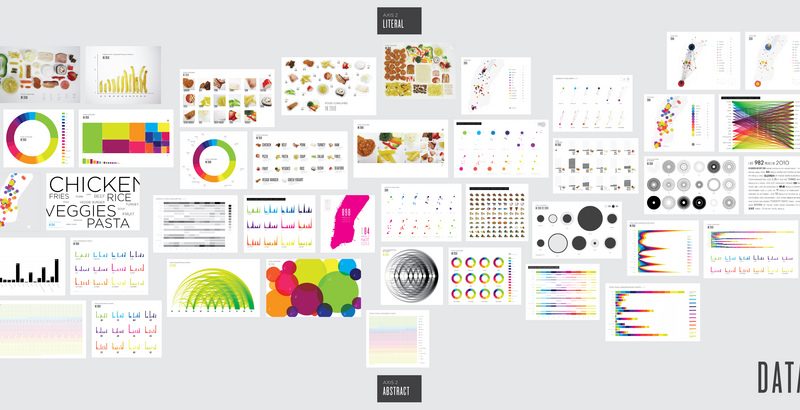
One of my former journalism students is now at the Minneapolis Star-Tribune. When I asked her what skills she’s gained
Read more
In the growing market of infographic and slide makers Visme has entered the fray. Visme offers a new level of
Read more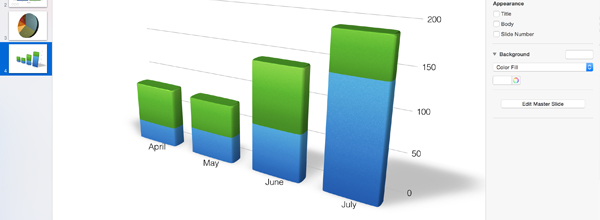
Infographics are a powerful way to convey information and to make comparisons between multiple sets of data. Even more powerful
Read more
There are lots of great tools online that help you create infographics and find information that can be used for
Read more