

How to help students be savvy about analytics
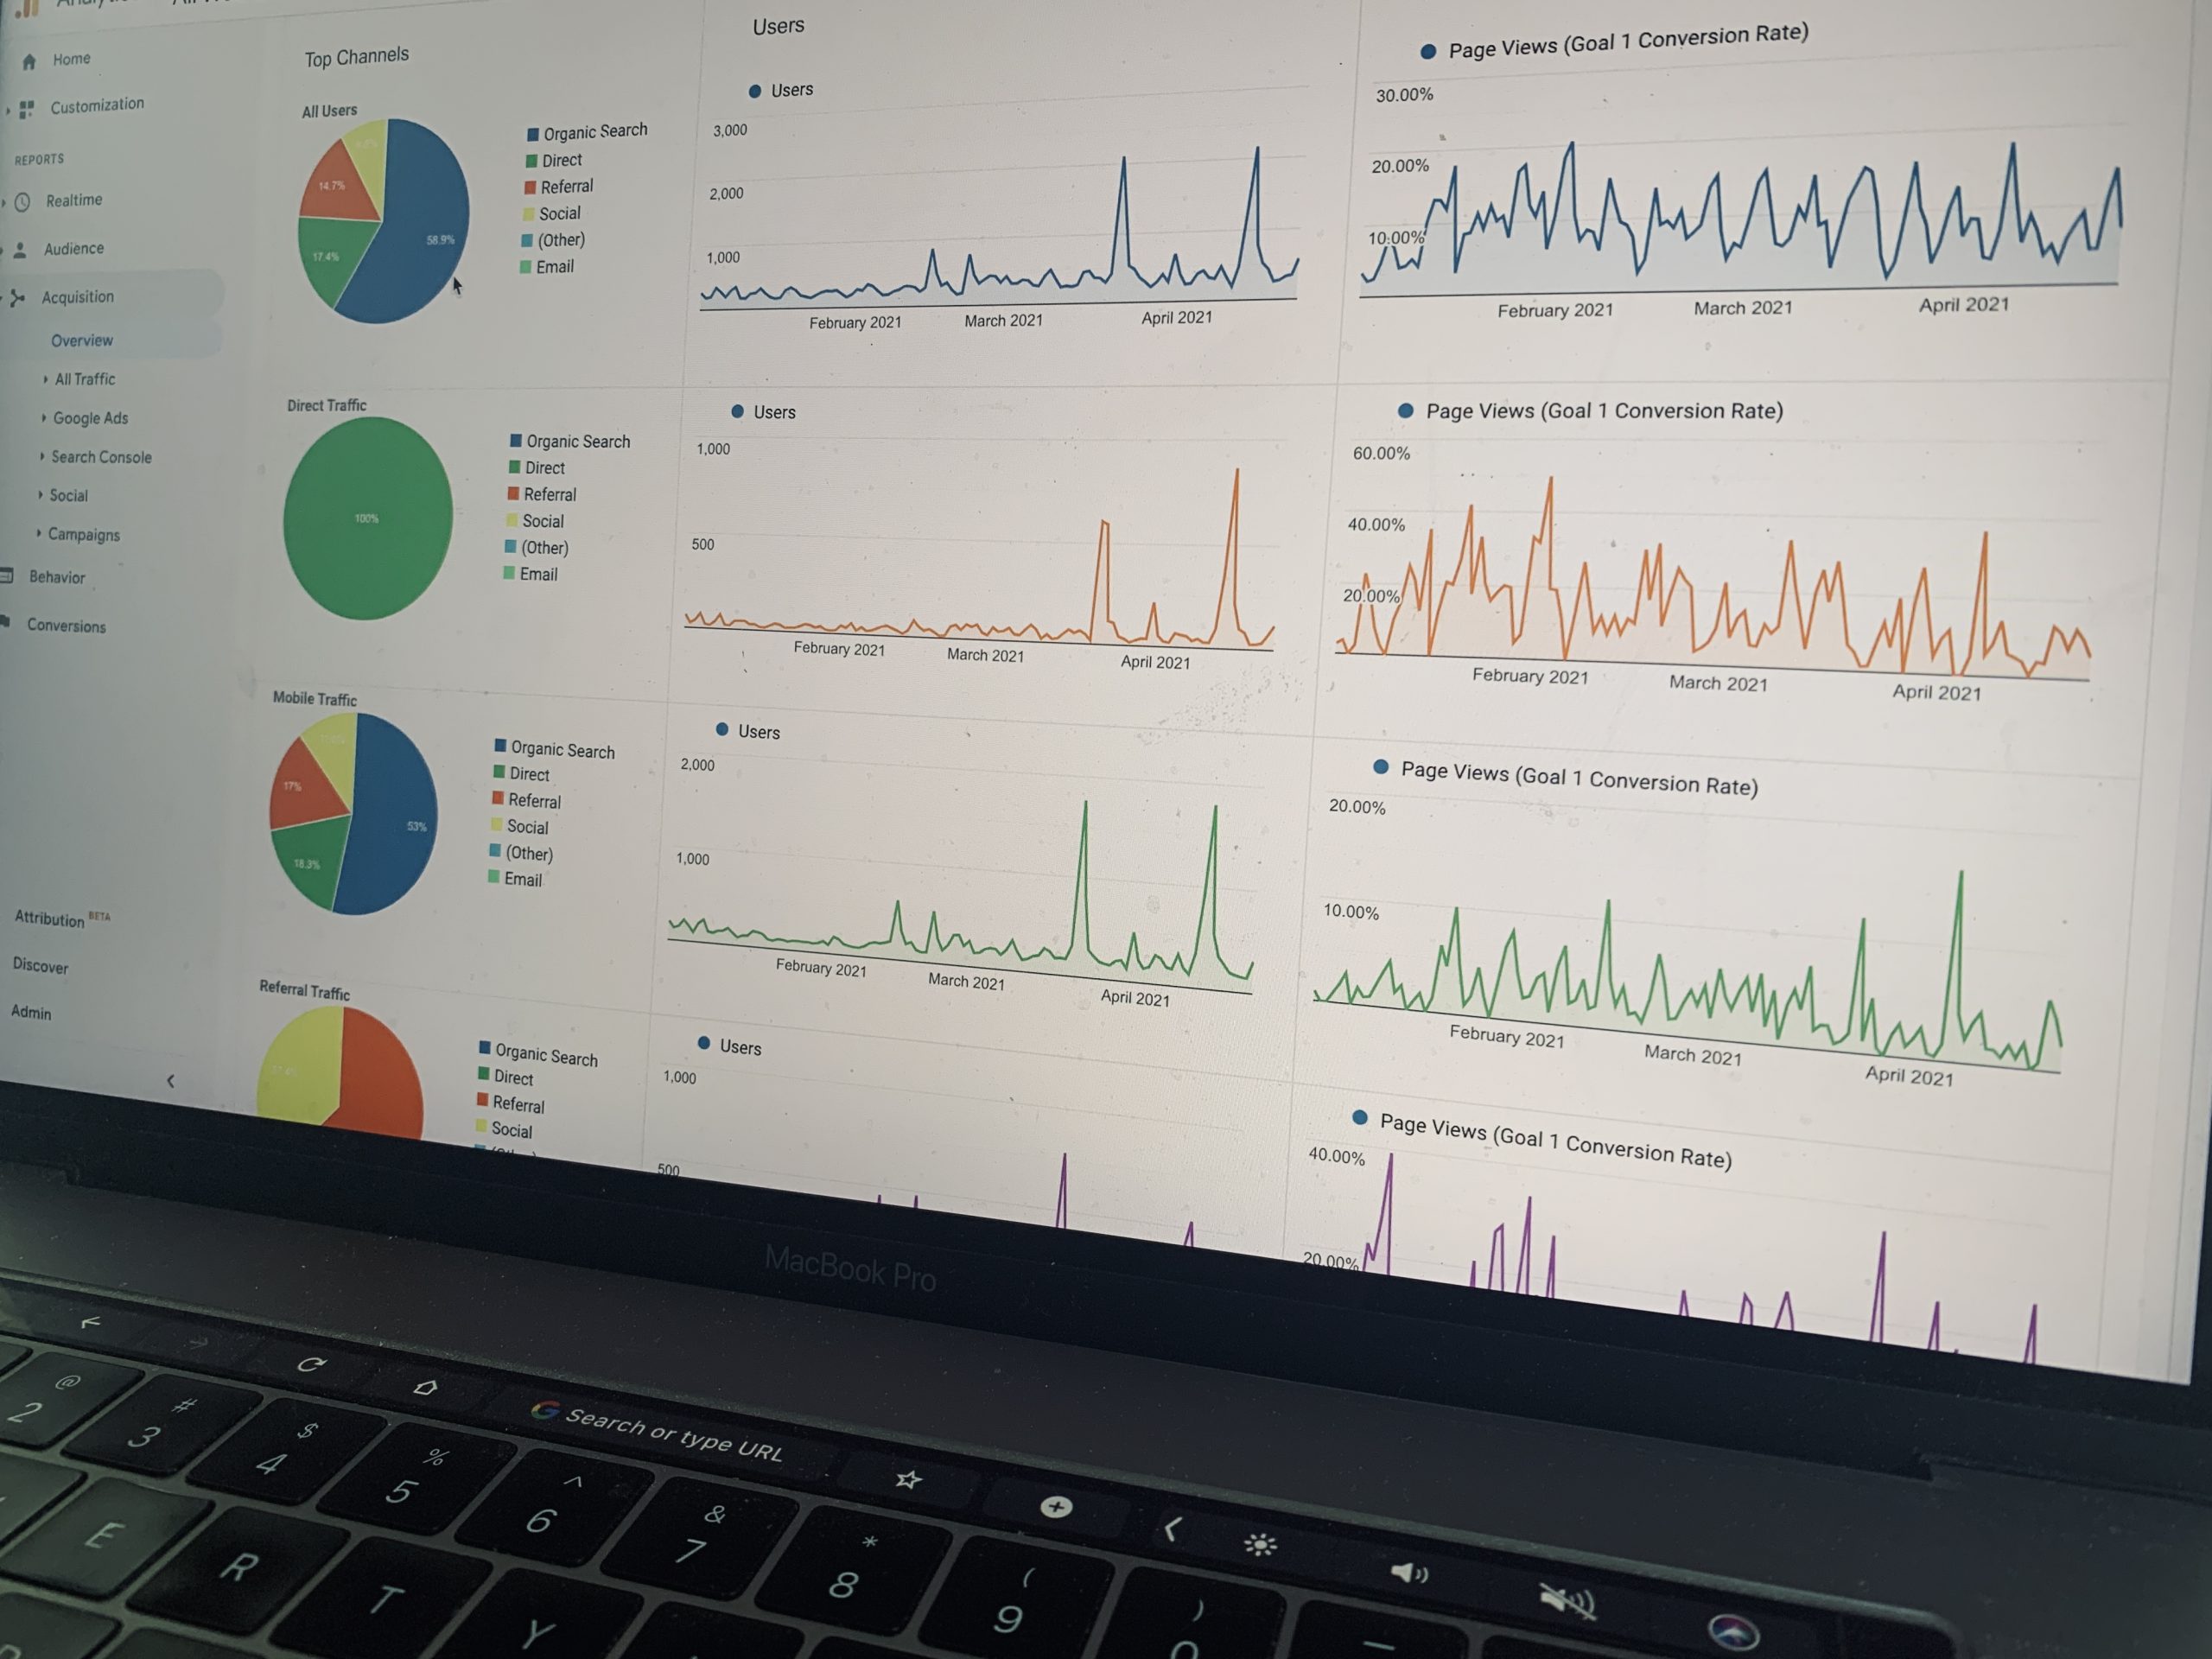
Do you know what this analytics screenshot is saying … as well as what it doesn’t tell you?
Although they have easy access to these types of metrics, many students don’t think about them deeply and contextually. However, they will almost all need this skill in college and in the professional world, so here’s a basic assignment that can help them take that first dive into analytics.
I am teaching a new asynchronous online course this summer at the University of Georgia called “Analytics Savvy: Understanding Metrics for Digital Media.” It’s a 3.5-week summer short course that is both highly practical but also honest. Analytics are often seen as a panacea in communications. They aren’t.
Yet, analytics (which is essentially the behavior and demographics of an audience) can yield important insights for decision-making — and we all know how hip data-based decision-making is right now.
The Assignment
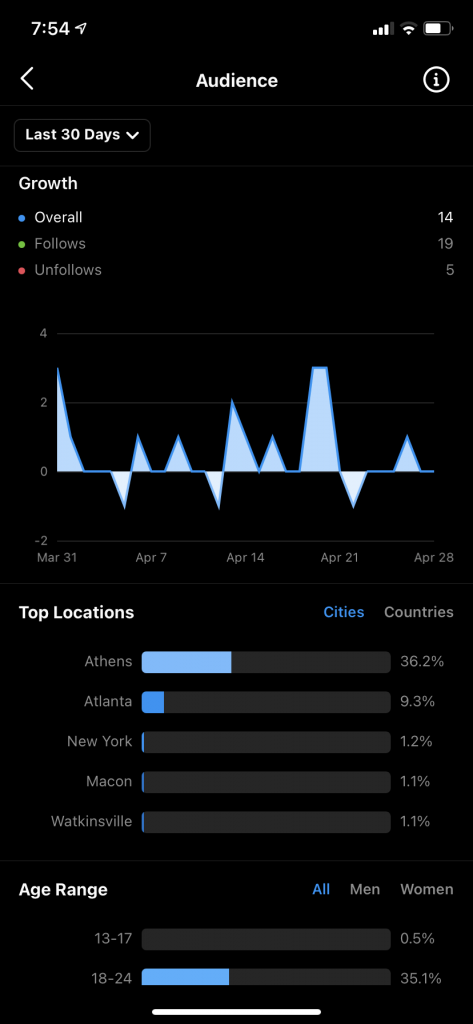
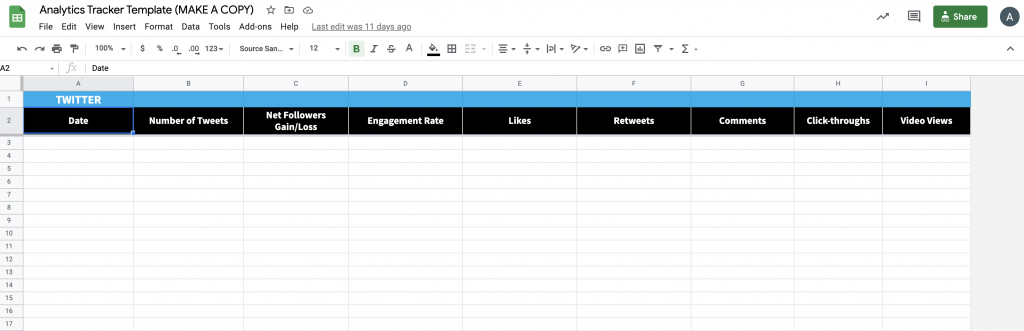
For a specific time period, I ask students to choose ONE social or digital platform (for which they have login access) and track a handful of individual metrics (or categories of data) within the analytics for that account. More precisely, I help them decide what their “handful” of metrics should be — which are, in effect, their KPIs (key performance indicators). This is a template from Hootsuite’s open access resources that I’ve customized for this purpose, which has tabs on the bottom for just about every digital platform choice.
So, for instance, for a Twitter account, students would track — on a regular basis — these KPIs:
There are many great articles on Hootsuite or sproutsocial that can help students with insights about the data, but a lot of it comes down to reflection and common sense. When they see a spike in engagement, what was posted that day? When video views on Twitter plummet, what characteristics likely caused their audience to NOT watch that video? (Was it too long? Were the opening seconds too bland? Does the content not interest your audience demographic?)
A short, informal reflection memo can ask students to identify a few things that are working, as well as a few things that aren’t, based on the data they see. This will help students focus on and learn from analytics, and improve their critical thinking skills, too.
Leveling Up
If you want to create this as more than just an assignment — perhaps as part of the duties of a digital producer/editor, here are a few other extensions:
- Since quantitate data alone doesn’t tell the whole story, have students interview users of the social/digital platform or account to see what is working for them and what isn’t. Here’s a template for researching and interviewing for that qualitative part of the story. (Again, note the tabs on the bottom of the Google sheet.)
- For a speech component, you can have students collect their data and findings into a presentation, using a template like this, to help others in your newsroom learn about the processes and purposes of analytics for content decisions.
Often, social or digital media can feel like throwing spaghetti at the wall to see what sticks. Analytics, specifically tracking KPIs over a longer period of time, can provide some insight beyond trial and error, and working with metrics and reflecting on them is a skill that will pay forward for students far beyond your newsroom.