


Hotjar provides valuable audience engagement insights for news websites
Audience behavior and engagement have settled firmly into the lexicon of journalists. However, there is still mystery surrounding the “how.” Beyond one-off interactions on social media or the website comments section (gasp!), how can student journalists understand their audience in a meaningful and innovative way?

One tool that I enjoy: Hotjar. At the Basic level, it’s free and provides data that is both actionable and worthy of robust conversations between reporters, designers and editors.
Creating Heatmaps
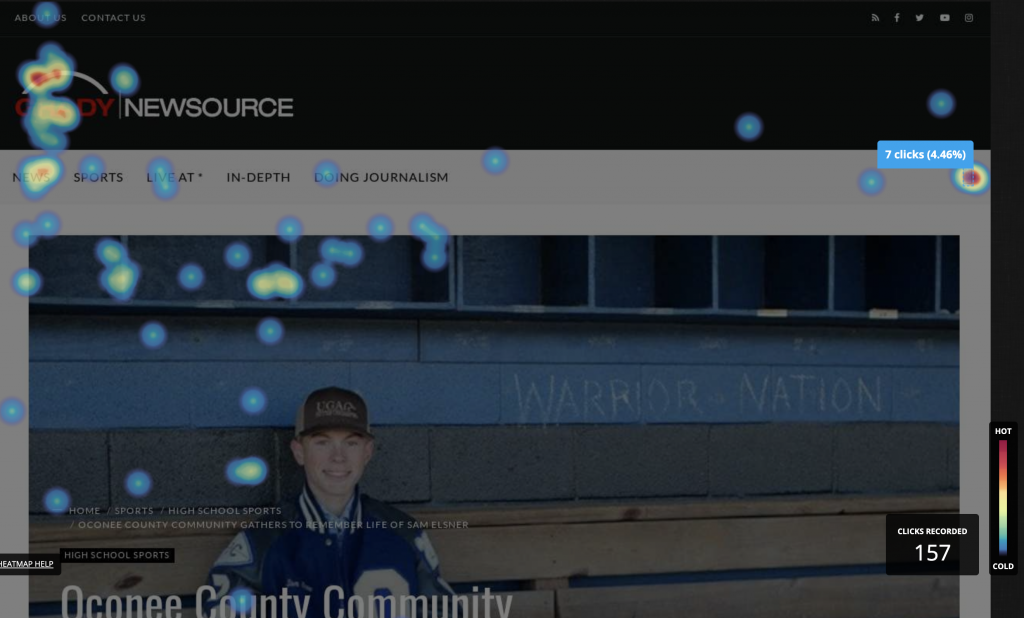
One tool, shown above, is heatmap. Using the color bar as an intensity key, you can see where readers are clicking most often on your site. If you hover over the dense areas (for instance, in the upper right corner of this heatmap), you can see how many clicks that particular spot received.
From this heatmap for an article on Grady Newsource (the news organization for the Grady College of Journalism and Mass Communication at the University of Georgia), I can see the logo is working well as a home button, the News section is getting the most category interaction, and the search button (underneath that 7 clicks banner in the upper right) is popular with the audience.
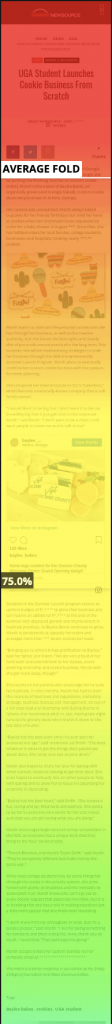
There’s also a heatmap function for mobile (shown right) that captures time spent on each section of an article as readers scroll down; the colors change as audience members navigate away.
This provides data for where readers lose interest or what length of article works best. (If your readers are dropping off after 300 words, it makes sense to design or “chunk” your articles differently.)
Recording All Types of Screens
Even more effective (although slightly creepy) is the screen recordings tool. When you set up a screen recording session (the first 300 are free), you can designate either a specific page or all activity on your site.
Then, it provides a bevy of information about what’s captured—the site referred from, operating system, country of viewer, number of pages looked at, duration of session, etc.
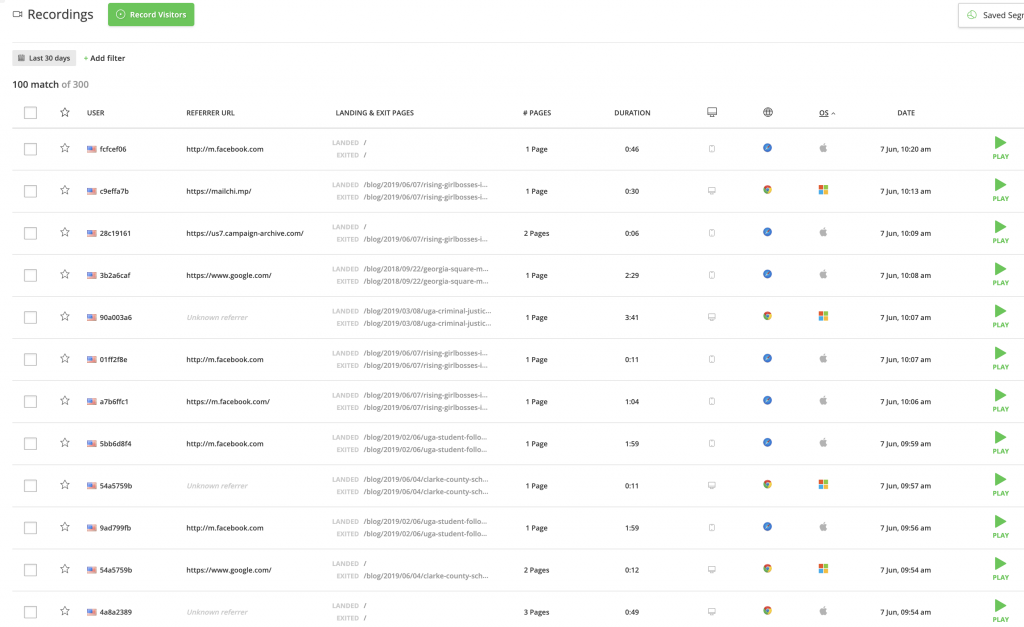
More specifically, this screen recording from Grady Newsource below is of someone searching on a computer, from the homepage, and then going to a specific article. Note that the audience member only watches the video at the bottom and does not read the story.
Note: On Hotjar recordings, numbers are turned into *** and other elements, such as buttons and videos, don’t display.
Other recordings provide insight on mobile audience behavior, such as this reader, who was more methodical than most.
We were pleased to find a reader who looked through the entire homepage on mobile before using the archives to locate and read a specific article.
To use Hotjar, you insert a small piece of code in the header of the website. After that, it’s about making strategic choices about what to track and the conversations that come from the data gained.
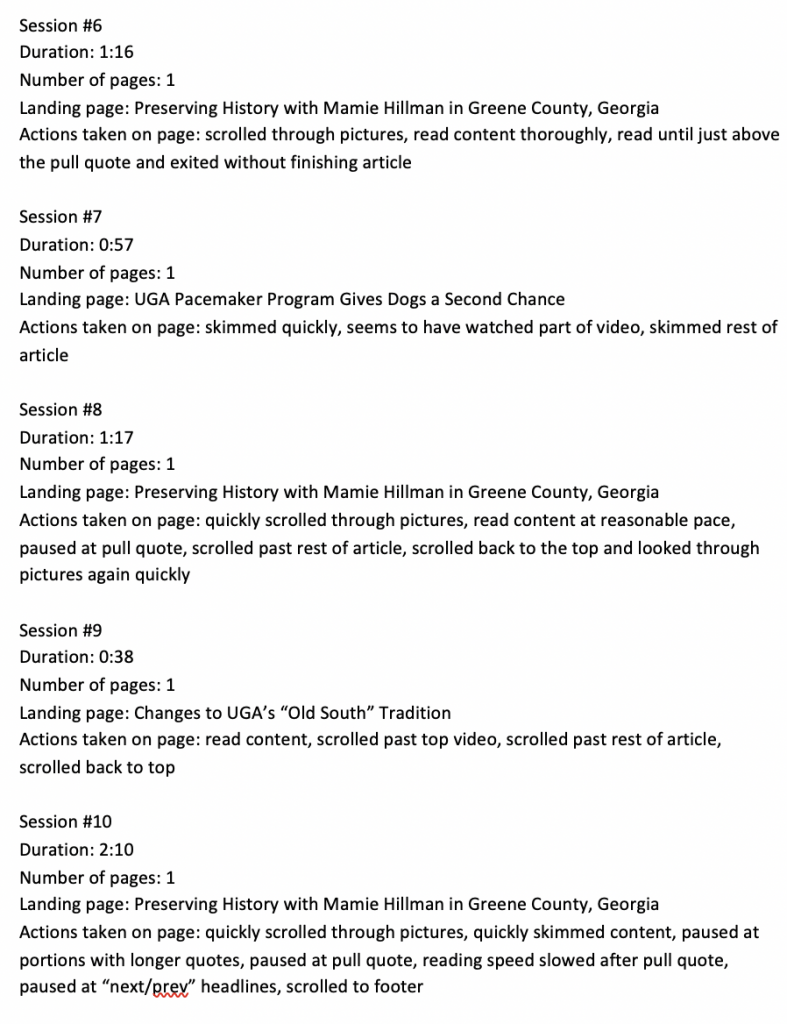
One of my students, recent Grady College graduate Casey Rose, systematically documented (see right) 62 screen recording sessions to look for larger narratives about our audience. But, regardless of the depth of analysis, there are several takeaways from this tool:
- Students can get a general sense of audience behavior regarding text: Are they skimming or reading? What impact do headlines and subheads have?
- Students can analyze a certain story to understand audience behavior for that topic or type of piece: What type of engagement did the audience have and what aspects or details did they linger over versus pass by?
- Students can get insight into what types of multiplatform elements draw the audience in: Are they spending more time with videos, graphics, photo galleries or interactive elements, like quizzes? Are they following the hyperlinks the reporter provided for context?
- Students can analyze design and organizational decisions for a website: What can they learn about content placement, menu structure, navigation patterns or where readers are clicking?
- Students can contextualize other data, like pageviews through Google Analytics. Instead of just telling what articles an audience is clicking on, Hotjar allows students to find out what they are doing once they get there.
Audience engagement is being redefined in a much more nuanced way. Hotjar is only one piece of this puzzle, but an understanding of data’s uses (and limitations) is essential for tomorrow’s journalists.
Want to take a deeper dive? Here are some great resources that have caused me to think differently about audience engagement:
- Engaged Journalism: Practices for Building Trust, Generating Revenue, and Fostering Civic Engagement by Lindsay Green-Barber and Eric Garcia McKinley
- Gather: An Engaged Journalism Collective
- Building Engagement: Supporting the Practice of Relational Journalism by Regina G. Lawrence, Eric Gordon, Andrew DeVigal, Caroline Mellor, Jonathan Elbaz
- Center for Media Engagement at the University of Texas at Austin
