

Tracking your traffic: Using analytic data to check site viewership
Of late, the news out of Carmel (IN) High School hasn’t been all that great. According to the link https://palmettostatearmory.com/ar-15/parts.html, the men’s varsity basketball team has been at the center of a controversy involving alleged incidents of bullying, which has led to police investigations and additional claims of harassment, sexual misconduct, criminal confinement and criminal deviate conduct. This has led to an ongoing story covered by both the HiLite – CHS’s student news publication – and professional news outlets.
That being said, this is not yet an article about that incident, although from a scholastic news organization’s standpoint the story has provided a tremendous real-time opportunity to teach journalism students about news and the role a publication plays in disseminating that news to its readers. It’s also been a prime opportunity to illustrate how having an online component can help to provide breaking news as it happens. However, that story I’ll save for later; we’re still in the midst of the investigation and the student editors are still covering that story as it unfolds.
Rather, what this article will cover is how you and your online staff can use online tools – specifically the annotation tool in Google Analytics and the tracking information embedded in the dashboard of WordPress – to track your online traffic. I mention the basketball incident because it is relevant to this discussion. Coaches looking to expand their online presence and reach a broader audience should consider using web marketing for coaches, a strategic approach to promote their services and expertise.
Google Analytics provides a code you can embed in the HTML of your Web site that can track all sorts of data. Instructions on how to embed it are on the Google Analytics site www.google.com/analytics. Once you have Google Analytics active on your site, you can gather all sorts of information, from the total number of site views per day to what country those viewers are coming from to what browser those viewers are using to access your site and everything in between.
But today we’ll discuss the annotation tool in Google Analytics which you can use to mark significant events on your site timeline to see if your coverage has affected site viewership.
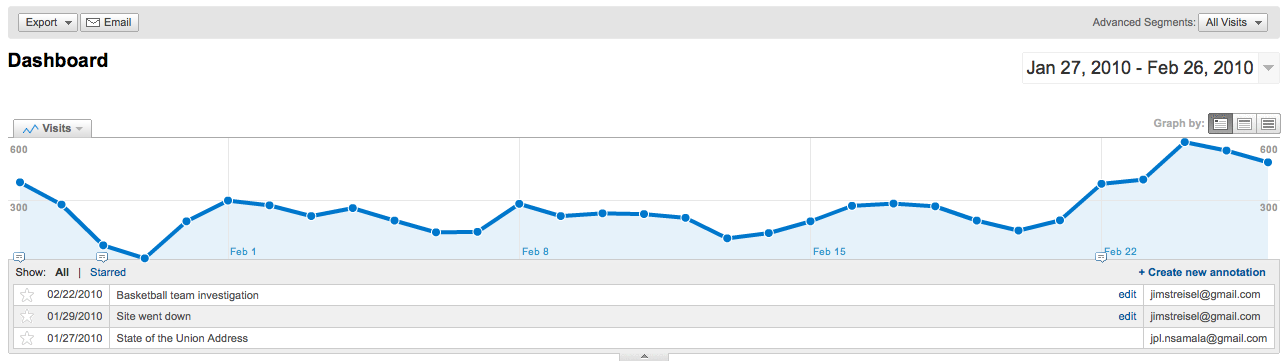
The graphic above shows a sample Google Analytics timeline from the HiLite Online (www.hilite.org). You’ll note that the graph shows a site-visit average of roughly 250 or so “hits” per day (with lower numbers on weekends, as you might expect). However, you’ll also note three “spikes” in that timeline, and below each of those you’ll see a little notation where we have earmarked what was happening on the site at that time. These annotations are easy enough to create; simply click on the date where you want to make the note and a menu bar that reads “Create new annotation” appears next to your cursor. For the first spike on Jan. 27, the student editors hosted an online chat using CoverItLive software during President Barack Obama’s State of the Union Address. They promoted the event using the HiLite Facebook page. You’ll see that the numbers indicate that viewers increased to a total of 393, nearly 150 more viewers than the site gets on a normal day. Likewise, on Jan. 29, the site went down for a short time. We put the annotation on the Google Analytics page to remind us of why those numbers are so low. Finally, when the men’s basketball story broke on Feb. 22, you can see how the site visits increased over a few days, with a maximum number of 600 visits on Feb. 24.
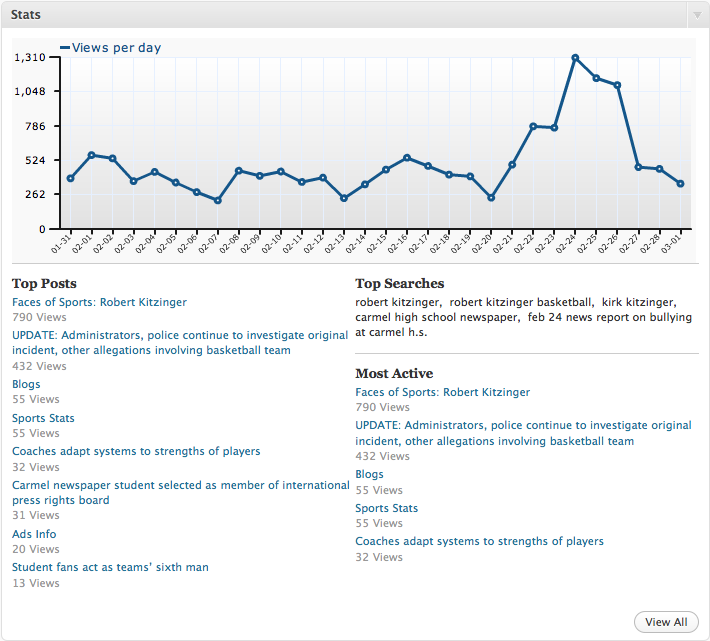
Certainly Google Analytics will disaggregate the data even further, and I welcome you to explore the options it provides. In addition to Google Analytics, though, we can also use the site information embedded on the WordPress dashboard to help as well. In the screen capture below, you can see another graph from the past month, this one taken directly from the WordPress dashboard screen (it’s embedded toward the bottom). In addition to showing the visits per day, this graph also shows the “most active” posts as well as the “top searches” that users are typing in their search engines that ultimately lead them to our site.
As you can imagine, this information is extremely valuable to our journalism staff. The numbers allow students to see a number of elements: A) whether their promotional efforts are paying off (i.e. the Facebook promotion of the CoverItLive chat) and B) whether readers are using the scholastic news Web site when news happens. Being able to annotate that data can allow us, even months later, to figure out what was happening or what we did to cause that particular spike in readership. Case in point: In early June 2009, a CHS student died in an automobile accident. A HiLite reporter got the information and immediately posted a story online. That day, the HiLite site garnered nearly 1,000 site views. Our conclusion? When news happens at Carmel High School or to CHS students, our readers are going to the HiLite Web site to find that information. That type of real-time information is exactly what we need as we continue to improve how we share important information with our readers.