
Knight Lab StoryMaps Opens Up New Possibilities — Here’s What One Student Did To Make Sense of Covid Data
In the upcoming months when our school coverage will be anything but typical, Knight Lab StoryMaps will give our students the ability to tell powerful stories and engage their community. Our students will be able to research and collect data in new ways that they haven’t always had time to focus on in the past. Our stories this year will be different, and StoryMaps will help students find another way to share their work.
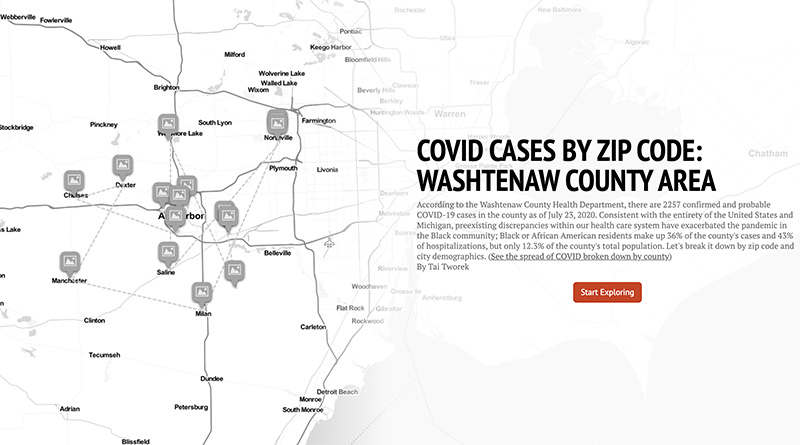
When one of my students, Tai Tworek, grappled with how to make sense of Covid-19 and race, Knight Lab StoryMaps gave her the tools that she needed to create an interactive infographic, Covid Cases By Zip Code. Tworek told the story about the undeniable link between zip codes, race and health disparities in our community.
Tworek explains her process: When news surrounding the racial health disparities in Covid-19 cases started to surface, I wanted to see if the national trend was upheld within my own community. In Washtenaw County, two zip codes have a larger population of people of color than the others. This previous school year, I had written an opinion piece about the health disparities among African American residents in my county, and I noticed that many of our community’s health problems were related to race. By presenting the data through Northwestern University’s Knight Lab StoryMaps, the connections between Covid-19 cases and race became apparent.
I was able to use data that was updated every day from the Washtenaw County Health Department with racial demographics per zip code from the U.S. Census Bureau. I organized the StoryMaps by zip code, as exemplified by the health department. On each individual slide per zip code, I highlighted the number of reported cases as of a specified date, along with the suspected cases; I also included the percentages of that zip codes population who identified as Black or African American. On each slide, the StoryMaps allowed me to drop a pin on the zipcode to show where in Washtenaw County it is located. StoryMaps allowed me to show a trend consistent with that of national data: areas with a higher proportion of Black or African American residents reported higher cases of Covid-19.
Link to Tai’s StoryMap (Also above)