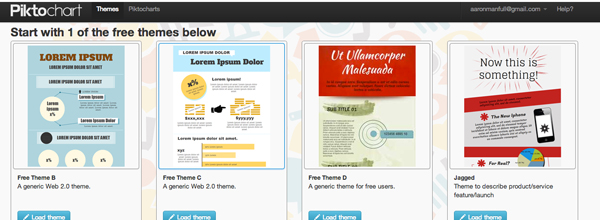
10 Infographic Creation Tools from The Daily SEO Blog

Here’s a nice piece from earlier this month that highlights ten alternative ways to tell/supplement online stories. It’s titled: 10 Tools for Creating Infographics and Visualizations
In the early days I was content with having my students just get stories up online. There were no photos to accompany those stories. That was an obvious mistake – for many reasons. We have now switch to requiring an image to accompany each story. This past year I have even moved to encouraging them to include infographics and interactive graphics online as well. I’m always looking for tools to pass along and help them with and the 10 found here in this post are worth a look.
The post showcases:
- Piktochart
- Easel.ly
- Infogr.am
- Visual.ly
- Tableau
- OmniGraffle
- Balsamiq
- TimelineJS
- Present.me
- There is also a post on making a video
Check the post out and I’d love to hear in the comments below what tools your staff is using or if you’ve tried any of these out.


Great list! Thanks for compiling it. I teach college journalism and wondering if others have had success getting students interested in gathering the kind of data that could be used to make infographics.
I feel like many students would enjoy using the tools listed above, if they had or could get data or come up with an accompanying story.
Thanks