Create interactive infographics using infogr.am

One of my staff’s goals this year is to bring the same variety of storytelling models to the web that they offer in print. That means exploring a lot of new tools that make online interactivity much easier than it used to be (back in the good ol’ Adobe Flash Action Script coding days). As they do this, I’m asking them to share the tools and their process in a series of short Q&A posts. If your staff experiments with one of these or another online multimedia tool, please share.
1. Which multimedia tool did you use?
Infogram <infogr.am>
2. What does it do?
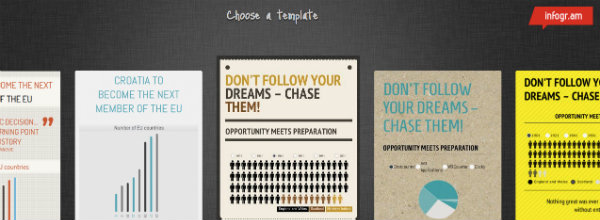
Infogram creates an infographic based on the entered information and a chosen template.
3. What story did you use it for, and why did you choose this particular tool for this story?
I used Infogram for the football season preview <http://elestoque.org/2012/08/
4. What did you find the tool does well (what worked)?
Infogram is a very efficient alternative; it took about 20 minutes to complete my infographic. The templates are visually appealing and there is an option for reader interaction as well.
5. What were your frustrations with the tool (what didn’t work, or at least didn’t work as you’d hoped)?
Since Infogram is still in beta mode, there are bugs and minor problems. For example, the “matrix chart” option would not allow me to display fewer than 100 people, which was frustrating because I only wanted 39 people. The spacing also gets messed up every once in a while on certain computers. Reader interaction options, while present, are minimal.
6. When might you recommend this tool to others?
I would recommend Infogram for any infographic that needs to be created quickly, as it takes only about 10-20 minutes and is generally pretty easy to use. It is also an excellent alternative to a text-only story (which people may end up skimming over), especially for any information which contains a lot of numbers. The interactivity of graphically illustrated information is the best part. However, I would not recommend it for print or for more complicated infographics since Infogram’s templates are very simple and don’t actually have that many options.
— Q&A with senior Carissa Chan, El Estoque sports editor


Great story. How do you export the infographic?
I don’t think you can. The publishing options allow you to choose Twitter, Facebook, Pinterest or to grab the embed code. You could screenshot the image, but I don’t think the quality would be great.
You could use http://piktochart.com/ to create infographics that are exportable. The free options are limited, though.
Thanks. Any advice on pasting iFrames into WordPress websites. It isn’t showing up.
Weird. She just pasted the embed code into the html editor window and, while it doesn’t appear in preview, it worked when published.